Sunday 1 July 2012

Data Warehousing Glossary


Aggregation: One way of speeding up query performance. Facts are summed up for selected dimensions from the original fact table. The resulting aggregate table will have fewer rows, thus making queries that can use them go faster.
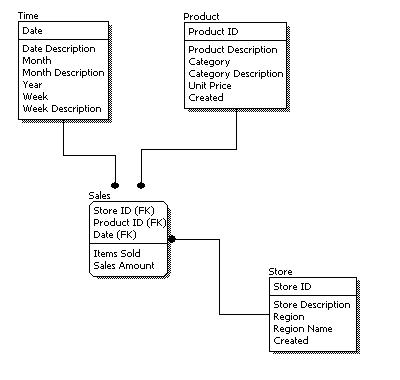
Attribute: Attributes represent a single type of information in a dimension. For example, year is an attribute in the Time dimension.
Conformed Dimension: A dimension that has exactly the same meaning and content when being referred to from different fact tables.
Data Mart: Data marts have the same definition as the data warehouse (see below), but data marts have a more limited audience and/or data content.
Data Warehouse: A warehouse is a subject-oriented, integrated, time-variant and non-volatile collection of data in support of management's decision making process (as defined by Bill Inmon).
Data Warehousing: The process of designing, building, and maintaining a data warehouse system.
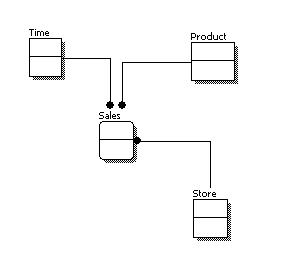
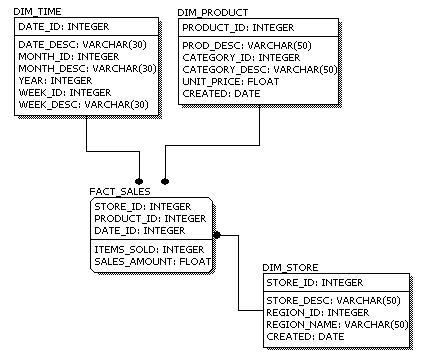
Dimension: The same category of information. For example, year, month, day, and week are all part of the Time Dimension.
Dimensional Model: A type of data modeling suited for data warehousing. In a dimensional model, there are two types of tables: dimensional tables and fact tables. Dimensional table records information on each dimension, and fact table records all the "fact", or measures.
Dimensional Table: Dimension tables store records related to this particular dimension. No facts are stored in a dimensional table.
Drill Across: Data analysis across dimensions.
Drill Down: Data analysis to a child attribute.
Drill Through: Data analysis that goes from an OLAP cube into the relational database.
Drill Up: Data analysis to a parent attribute.

Data Warehousing Books


Below is a list of 5 most recently-published books related to data warehousing. You can also view the books according to the following subject areas:
Oracle Warehouse Builder
Oracle Warehouse Builder 11G R2: Getting Started
By
Published on

This book talks about how to use Oracle Warehouse Builder 11G R2.


Microsoft Data Warehouse Toolkit
The Microsoft Data Warehouse Toolkit: With SQL Server 2008 R2 and the Microsoft Business Intelligence Toolset
By
Published on

This book explains how to build a data warehouse using the Microsoft SQL Server 2008 R2 and Office 2010 technology, including discussions on PowerPivot for Excel and SharePoint, Master Data Services, as well as updated capabilities of SQL Server Analysis, Integration, and Reporting Services.


Business Intelligence Strategy
Business Intelligence Strategy; A Practical Guide for Achieving BI Excellence
By
Published on

Geared toward IT management and business executives seeking to excel in business intelligence initiatives, this practical guide explores creating business alignment strategies that help prioritize business requirements, build organizational and cultural strategies, increase IT efficiency, and promote user adoption.


Pentaho Kettle Solutions
Pentaho Kettle Solutions: Building Open Source ETL Solutions with Pentaho Data Integration
By
Published on

This practical book is a complete guide to installing, configuring, and managing Pentaho Kettle. Get up to speed on Kettle basics and learn how to apply Kettle to create ETL solutions. Learn how to design and build every phase of an ETL solution.


Data Modeling A Beginners Guide
Data Modeling, A Beginner's Guide
By
Published on

This book teaches you techniques for gathering business requirements and using them to produce conceptual, logical, and physical database designs.


ETL Books OLAP Books Business Intelligence Books
General Books Data Modeling Books Vendor-Specific Books

Saturday 30 June 2012

Data Warehousing - Data Warehouse Team Selection


There are two areas of discussion: First is whether to use external consultants or hire permanent employees. The second is on what type of personnel is recommended for a data warehousing project.
The pros of hiring external consultants are:
1. They are usually more experienced in data warehousing implementations. The fact of the matter is, even today, people with extensive data warehousing backgrounds are difficult to find. With that, when there is a need to ramp up a team quickly, the easiest route to go is to hire external consultants.
The pros of hiring permanent employees are:
1. They are less expensive. With hourly rates for experienced data warehousing professionals running from $100/hr and up, and even more for Big-5 or vendor consultants, hiring permanent employees is a much more economical option.
2. They are less likely to leave. With consultants, whether they are on contract, via a Big-5 firm, or one of the tool vendor firms, they are likely to leave at a moment's notice. This makes knowledge transfer very important. Of course, the flip side is that these consultants are much easier to get rid of, too.
The following roles are typical for a data warehouse project:
  • Project Manager: This person will oversee the progress and be responsible for the success of the data warehousing project.
  • DBA: This role is responsible to keep the database running smoothly. Additional tasks for this role may be to plan and execute a backup/recovery plan, as well as performance tuning.
  • Technical Architect: This role is responsible for developing and implementing the overall technical architecture of the data warehouse, from the backend hardware/software to the client desktop configurations.
  • ETL Developer: This role is responsible for planning, developing, and deploying the extraction, transformation, and loading routine for the data warehouse.
  • Front End Developer: This person is responsible for developing the front-end, whether it be client-server or over the web.
  • OLAP Developer: This role is responsible for the development of OLAP cubes.
  • Trainer: A significant role is the trainer. After the data warehouse is implemented, a person on the data warehouse team needs to work with the end users to get them familiar with how the front end is set up so that the end users can get the most benefit out of the data warehouse system.
  • Data Modeler: This role is responsible for taking the data structure that exists in the enterprise and model it into a schema that is suitable for OLAP analysis.
  • QA Group: This role is responsible for ensuring the correctness of the data in the data warehouse. This role is more important than it appears, because bad data quality turns away users more than any other reason, and often is the start of the downfall for the data warehousing project. The above list is roles, and one person does not necessarily correspond to only one role. In fact, it is very common in a data warehousing team where a person takes on multiple roles. For a typical project, it is common to see teams of 5-8 people. Any data warehousing team that contains more than 10 people is definitely bloated.
  • Data Warehousing - Open Source Business Intelligence


    What is open source business intelligence?

    Open source BI are BI software can be distributed for free and permits users to modify the source code. Open source software is available in all BI tools, from data modeling to reporting to OLAP to ETL.
    Because open source software is community driven, it relies on the community for improvement. As such, new feature sets typically come from community contribution rather than as a result of dedicated R&D efforts.

    Advantages of open source BI tools

    Easy to get started
    With traditional BI software, the business model typically involves a hefty startup cost, and then there is an annual fee for support and maintenance that is calculated as a percentage of the initial purchase price. In this model, a company needs to spend a substantial amount of money before any benefit is realized. With the substantial cost also comes the need to go through a sales cycle, from the RFP process to evaluation to negotiation, and multiple teams within the organization typically get involved. These factors mean that it's not only costly to get started with traditional BI software, but the amount of time it takes is also long.
    With open source BI, the beginning of the project typically involves a free download of the software. Given this, bureaucracy can be kept to a minimum and it is very easy and inexpensive to get started.
    Lower cost
    Because of its low startup cost and the typically lower ongoing maintenance/support cost, the cost for open source BI software is lower (sometimes much lower) than traditional BI software.
    Easy to customize
    By definition, open source software means that users can access and modify the source code directly. That means it is possible for developers to get under the hood of the open source BI tool and add their own features. In contrast, it is much more difficult to do this with traditional BI software because there is no way to access the source code.

    Disadvantages of open source BI tools

    Features are not as robust
    Traditional BI software vendors put in a lot of money and resources into R&D, and the result is that the product has a rich feature set. Open source BI tools, on the other hand, rely on community support, and hence do not have as strong a feature set.
    Consulting help not as readily available
    Most of the traditional BI software - MicroStrategy, Business Objects, Cognos, Oracle and so on, have been around for a long time. As a result, there are a lot of people with experience with those tools, and finding consulting help to implement these solutions is usually not very difficult. Open source BI tools, on the other hand, are a fairly recent development, and there are relatively few people with implementation experience. So, it is more difficult to find consulting help if you go with open source BI.

    Open source BI tool vendors

    Friday 29 June 2012

    Data Warehousing - Metadata Tool Selection


    Buy vs. Build
    Only in the rarest of cases does it make sense to build a metadata tool from scratch. This is because doing so requires resources that are intimately familiar with the operational, technical, and business aspects of the data warehouse system, and such resources are difficult to come by. Even when such resources are available, there are often other tasks that can provide more value to the organization than to build a metadata tool from scratch.
    In fact, the question is often whether any type of metadata tool is needed at all. Although metadata plays an extremely important role in a successful data warehousing implementation, this does not always mean that a tool is needed to keep all the "data about data." It is possible to, say, keey such information in the repository of other tools used, in a text documentation, or even in a presentation or a spreadsheet.

    Having said the above, though, it is author's believe that having a solid metadata foundation is one of the keys to the success of a data warehousing project. Therefore, even if a metadata tool is not selected at the beginning of the project, it is essential to have a metadata strategy; that is, how metadata in the data warehousing system will be stored.
    Metadata Tool Functionalities
    This is the most difficult tool to choose, because there is clearly no standard. In fact, it might be better to call this a selection of the metadata strategy. Traditionally, people have put the data modeling information into a tool such as ERWin and Oracle Designer, but it is difficult to extract information out of such data modeling tools. For example, one of the goals for your metadata selection is to provide information to the end users. Clearly this is a difficult task with a data modeling tool.
    So typically what is likely to happen is that additional efforts are spent to create a layer of metadata that is aimed at the end users. While this allows the end users to gain the required insight into what the data and reports they are looking at means, it is clearly inefficient because all that information already resides somewhere in the data warehouse system, whether it be the ETL tool, the data modeling tool, the OLAP tool, or the reporting tool.
    There are efforts among data warehousing tool vendors to unify on a metadata model. In June of 2000, the OMG released a metadata standard called CWM (Common Warehouse Metamodel), and some of the vendors such as Oracle have claimed to have implemented it. This standard incorporates the latest technology such as XML, UML, and SOAP, and, if accepted widely, is truly the best thing that can happen to the data warehousing industry. As of right now, though, the author has not really seen that many tools leveraging this standard, so clearly it has not quite caught on yet.
    So what does this mean about your metadata efforts? In the absence of everything else, I would recommend that whatever tool you choose for your metadata support supports XML, and that whatever other tool that needs to leverage the metadata also supports XML. Then it is a matter of defining your DTD across your data warehousing system. At the same time, there is no need to worry about criteria that typically is important for the other tools such as performance and support for parallelism because the size of the metadata is typically small relative to the size of the data warehouse.

    Reporting Tool Selection


    Buy vs. Build
    There is a wide variety of reporting requirements, and whether to buy or build a reporting tool for your business intelligence needs is also heavily dependent on the type of requirements. Typically, the determination is based on the following:
    • Number of reports: The higher the number of reports, the more likely that buying a reporting tool is a good idea. This is not only because reporting tools typically make creating new reports easier (by offering re-usable components), but they also already have report management systems to make maintenance and support functions easier.
    • Desired Report Distribution Mode: If the reports will only be distributed in a single mode (for example, email only, or over the browser only), we should then strongly consider the possibility of building the reporting tool from scratch. However, if users will access the reports through a variety of different channels, it would make sense to invest in a third-party reporting tool that already comes packaged with these distribution modes.
    • Ad Hoc Report Creation: Will the users be able to create their own ad hoc reports? If so, it is a good idea to purchase a reporting tool. These tool vendors have accumulated extensive experience and know the features that are important to users who are creating ad hoc reports. A second reason is that the ability to allow for ad hoc report creation necessarily relies on a strong metadata layer, and it is simply difficult to come up with a metadata model when building a reporting tool from scratch.
    Reporting Tool Functionalities
    Data is useless if all it does is sit in the data warehouse. As a result, the presentation layer is of very high importance.
    Most of the OLAP vendors already have a front-end presentation layer that allows users to call up pre-defined reports or create ad hoc reports. There are also several report tool vendors. Either way, pay attention to the following points when evaluating reporting tools:
  • Data source connection capabilities In general there are two types of data sources, one the relationship database, the other is the OLAP multidimensional data source. Nowadays, chances are good that you might want to have both. Many tool vendors will tell you that they offer both options, but upon closer inspection, it is possible that the tool vendor is especially good for one type, but to connect to the other type of data source, it becomes a difficult exercise in programming.
  • Scheduling and distribution capabilities In a realistic data warehousing usage scenario by senior executives, all they have time for is to come in on Monday morning, look at the most important weekly numbers from the previous week (say the sales numbers), and that's how they satisfy their business intelligence needs. All the fancy ad hoc and drilling capabilities will not interest them, because they do not touch these features.
    Based on the above scenario, the reporting tool must have scheduling and distribution capabilities. Weekly reports are scheduled to run on Monday morning, and the resulting reports are distributed to the senior executives either by email or web publishing. There are claims by various vendors that they can distribute reports through various interfaces, but based on my experience, the only ones that really matter are delivery via email and publishing over the intranet.
  • Security Features: Because reporting tools, similar to OLAP tools, are geared towards a number of users, making sure people see only what they are supposed to see is important. Security can reside at the report level, folder level, column level, row level, or even individual cell level. By and large, all established reporting tools have these capabilities. Furthermore, they have a security layer that can interact with the common corporate login protocols. There are, however, cases where large corporations have developed their own user authentication mechanism and have a "single sign-on" policy. For these cases, having a seamless integration between the tool and the in-house authentication can require some work. I would recommend that you have the tool vendor team come in and make sure that the two are compatible.
  • Customization Every one of us has had the frustration over spending an inordinate amount of time tinkering with some office productivity tool only to make the report/presentation look good. This is definitely a waste of time, but unfortunately it is a necessary evil. In fact, a lot of times, analysts will wish to take a report directly out of the reporting tool and place it in their presentations or reports to their bosses. If the reporting tool offers them an easy way to pre-set the reports to look exactly the way that adheres to the corporate standard, it makes the analysts jobs much easier, and the time savings are tremendous.
  • Export capabilities The most common export needs are to Excel, to a flat file, and to PDF, and a good report tool must be able to export to all three formats. For Excel, if the situation warrants it, you will want to verify that the reporting format, not just the data itself, will be exported out to Excel. This can often be a time-saver.
  • Integration with the Microsoft Office environment Most people are used to work with Microsoft Office products, especially Excel, for manipulating data. Before, people used to export the reports into Excel, and then perform additional formatting / calculation tasks. Some reporting tools now offer a Microsoft Office-like editing environment for users, so all formatting can be done within the reporting tool itself, with no need to export the report into Excel. This is a nice convenience to the users.
    Popular Tools
  • Business Intelligence: OLAP Tool Selection

    Buy vs. Build
    OLAP tools are geared towards slicing and dicing of the data. As such, they require a strong metadata layer, as well as front-end flexibility. Those are typically difficult features for any home-built systems to achieve. Therefore, my recommendation is that if OLAP analysis is part of your charter for building a data warehouse, it is best to purchase an existing OLAP tool rather than creating one from scratch.
    OLAP Tool Functionalities
    Before we speak about OLAP tool selection criterion, we must first distinguish between the two types of OLAP tools, MOLAP (Multidimensional OLAP) and ROLAP (Relational OLAP).
    1. MOLAP: In this type of OLAP, a cube is aggregated from the relational data source (data warehouse). When user generates a report request, the MOLAP tool can generate the create quickly because all data is already pre-aggregated within the cube.
    2. ROLAP: In this type of OLAP, instead of pre-aggregating everything into a cube, the ROLAP engine essentially acts as a smart SQL generator. The ROLAP tool typically comes with a 'Designer' piece, where the data warehouse administrator can specify the relationship between the relational tables, as well as how dimensions, attributes, and hierarchies map to the underlying database tables.
    Right now, there is a convergence between the traditional ROLAP and MOLAP vendors. ROLAP vendor recognize that users want their reports fast, so they are implementing MOLAP functionalities in their tools; MOLAP vendors recognize that many times it is necessary to drill down to the most detail level information, levels where the traditional cubes do not get to for performance and size reasons.
    So what are the criteria for evaluating OLAP vendors? Here they are:
  • Ability to leverage parallelism supplied by RDBMS and hardware: This would greatly increase the tool's performance, and help loading the data into the cubes as quickly as possible.
  • Performance: In addition to leveraging parallelism, the tool itself should be quick both in terms of loading the data into the cube and reading the data from the cube.
  • Customization efforts: More and more, OLAP tools are used as an advanced reporting tool. This is because in many cases, especially for ROLAP implementations, OLAP tools often can be used as a reporting tool. In such cases, the ease of front-end customization becomes an important factor in the tool selection process.
  • Security Features: Because OLAP tools are geared towards a number of users, making sure people see only what they are supposed to see is important. By and large, all established OLAP tools have a security layer that can interact with the common corporate login protocols. There are, however, cases where large corporations have developed their own user authentication mechanism and have a "single sign-on" policy. For these cases, having a seamless integration between the tool and the in-house authentication can require some work. I would recommend that you have the tool vendor team come in and make sure that the two are compatible.
  • Metadata support: Because OLAP tools aggregates the data into the cube and sometimes serves as the front-end tool, it is essential that it works with the metadata strategy/tool you have selected. Popular Tools
  • Thursday 28 June 2012

    Data Warehousing - ETL Tool Selection


    Buy vs. Build
    When it comes to ETL tool selection, it is not always necessary to purchase a third-party tool. This determination largely depends on three things:
    • Complexity of the data transformation: The more complex the data transformation is, the more suitable it is to purchase an ETL tool.
    • Data cleansing needs: Does the data need to go through a thorough cleansing exercise before it is suitable to be stored in the data warehouse? If so, it is best to purchase a tool with strong data cleansing functionalities. Otherwise, it may be sufficient to simply build the ETL routine from scratch.
    • Data volume. Available commercial tools typically have features that can speed up data movement. Therefore, buying a commercial product is a better approach if the volume of data transferred is large.
    ETL Tool Functionalities While the selection of a database and a hardware platform is a must, the selection of an ETL tool is highly recommended, but it's not a must. When you evaluate ETL tools, it pays to look for the following characteristics:
  • Functional capability: This includes both the 'transformation' piece and the 'cleansing' piece. In general, the typical ETL tools are either geared towards having strong transformation capabilities or having strong cleansing capabilities, but they are seldom very strong in both. As a result, if you know your data is going to be dirty coming in, make sure your ETL tool has strong cleansing capabilities. If you know there are going to be a lot of different data transformations, it then makes sense to pick a tool that is strong in transformation.
  • Ability to read directly from your data source: For each organization, there is a different set of data sources. Make sure the ETL tool you select can connect directly to your source data.
  • Metadata support: The ETL tool plays a key role in your metadata because it maps the source data to the destination, which is an important piece of the metadata. In fact, some organizations have come to rely on the documentation of their ETL tool as their metadata source. As a result, it is very important to select an ETL tool that works with your overall metadata strategy. Popular Tools
    • IBM WebSphere Information Integration (Ascential DataStage)
    • Ab Initio
    • Informatica
    • Talend
  • Data Warehousing - Database/Hardware Selection


    Buy vs. Build

    The only choices here are what type of hardware and database to purchase, as there is basically no way that one can build hardware/database systems from scratch.
    Database/Hardware Selections
    In making selection for the database/hardware platform, there are several items that need to be carefully considered:


  • Scalability: How can the system grow as your data storage needs grow? Which RDBMS and hardware platform can handle large sets of data most efficiently? To get an idea of this, one needs to determine the approximate amount of data that is to be kept in the data warehouse system once it's mature, and base any testing numbers from there.
  • Parallel Processing Support: The days of multi-million dollar supercomputers with one single CPU are gone, and nowadays the most powerful computers all use multiple CPUs, where each processor can perform a part of the task, all at the same time. When I first started working with massively parallel computers in 1993, I had thought that it would be the best way for any large computations to be done within 5 years. Indeed, parallel computing is gaining popularity now, although a little slower than I had originally thought.
  • RDBMS/Hardware Combination: Because the RDBMS physically sits on the hardware platform, there are going to be certain parts of the code that is hardware platform-dependent. As a result, bugs and bug fixes are often hardware dependent. True Case: One of the projects I have worked on was with a major RDBMS provider paired with a hardware platform that was not so popular (at least not in the data warehousing world). The DBA constantly complained about the bug not being fixed because the support level for the particular type of hardware that client had chosen was Level 3, which basically meant that no one in the RDBMS support organization will fix any bug particular to that hardware platform.
    Popular Relational Databases
    Popular OS Platforms
  • Wednesday 27 June 2012

    Business Intelligence Tool Selections: General Considerations


    When we evaluate which business intelligence tool to use, the first determination is the Buy vs. Build decision. We can use the following table to compare the two approaches.
    Category
    Buy
    Build
    Cost
    A
    Implementation Time
    A
    Documentation
    A
    Functionality / Features
    A
    Tailored for the exact needs
    A
    Reliance on third-party
    A
    Clearly, both approaches have its own advantages and disadvantages, and it is often wise to consider each of the components individually. For example, it is clearly not viable to write a relational database from scratch. Therefore, we may have a case where the hardware and the database are bought, but other tools are built from within. In general, deciding which approach to go is dependent on the following criteria:
    • User technical skills
    • Requirements
    • Available budget
    • Time
    Because each tool in the business intelligence arena has different functionalities, the criteria for the "Buy vs. Build" decision is different for each type. We will get into a more detailed discussion for each tool later.
    Should we decide to purchase an existing third-party business intelligence tool, we must then decide which one to buy. Often, there are a number of choices to pick from, some are well-known, and some others not as well-known, but
    In addition to tool functionalities, which we will discuss in the following sections, there are several considerations that we should take into account when considering tool vendors in general:

    Tool Vendor's Stability: More than anything else, this is probably the most important measure. In my opinion, this is even more important than the current functionalities that the tool itself provide, for the simple reason that if the company is going to be around for a while, it will be able to make enhancements to its business intelligence tool. On the other hand, if the company is likely to be out of business in six months, then it doesn't matter that it has the state-of-the-art features, because sooner or later these features will be out-of-date.
    Some of the ways to tell about company's stability are:
    • What type of office space is it occupying? Is it wasting money by renting the most expensive office space in the area just so that it can be noticed? Or is it plugging all its money back into R&D so that the product can be improved?
    • The background of senior management. The company might be new, but if it has seasoned veterans from major companies like IBM, Oracle, and Microsoft, to name a few, it is more likely to be successful because top management has seen how it's done right.
    Support: What type of support is offered? It is industry standard for vendors to charge an annual support fee that is 15-20% of the software product license. Will any software issues be handled promptly?
    Professional Services: This includes consulting and education. What type of consulting proposal does the vendor give? Is the personnel requirements and consulting rates reasonable? Is the vendor going to put in someone fresh out of college and charge $200/hr for that person? It might be wise to speak with members of the consulting team before signing on the dotted line. On the education front, what type of training is available? And how much is the consulting team willing to do knowledge transfer? Does the consulting team purposely hold off information so that either 1) you will need to send more people to vendor's education classes, or 2) you will need to hire additional consulting to make any changes to the system.

    Business Intelligence Software


    As the old Chinese saying goes, "To accomplish a goal, make sure the proper tools are selected." This is especially true when the goal is to achieve business intelligence. Given the complexity of the data warehousing system and the cross-departmental implications of the project, it is easy to see why the proper selection of business intelligence software and personnel is very important. This section will talk about the such selections. They are grouped into the following:
    • General Considerations
    • Database/Hardware
    • ETL Tools
    • OLAP Tools
    • Reporting Tools
    • Metadata Tools
    • Open Source Business Intelligence Tools
    • Data Warehouse Team Personnel

    Business Intellegence Uses


    Business intelligence usage can be categorized into the following categories:
    1. Business operations reporting
    The most common form of business intelligence is business operations reporting. This includes the actuals and how the actuals stack up against the goals. This type of business intelligence often manifests itself in the standard weekly or monthly reports that need to be produced.
    2. Forecasting
    Many of you have no doubt run into the needs for forecasting, and all of you would agree that forecasting is both a science and an art. It is an art because one can never be sure what the future holds. What if competitors decide to spend a large amount of money in advertising? What if the price of oil shoots up to $80 a barrel? At the same time, it is also a science because one can extrapolate from historical data, so it's not a total guess.
    3. Dashboard
    The primary purpose of a dashboard is to convey the information at a glance. For this audience, there is little, if any, need for drilling down on the data. At the same time, presentation and ease of use are very important for a dashboard to be useful.
    4. Multidimensional analysis
    Multidimensional analysis is the "slicing and dicing" of the data. It offers good insight into the numbers at a more granular level. This requires a solid data warehousing / data mart backend, as well as business-savvy analysts to get to the necessary data.
    5. Finding correlation among different factors
    This is diving very deep into business intelligence. Questions asked are like, "How do different factors correlate to one another?" and "Are there significant time trends that can be leveraged/anticipated?"

    Tuesday 26 June 2012

    Master Data Management


    What is Master Data Management

    Master Data Management (MDM) refers to the process of creating and managing data that an organization must have as a single master copy, called the master data. Usually, master data can include customers, vendors, employees, and products, but can differ by different industries and even different companies within the same industry. MDM is important because it offers the enterprise a single version of the truth. Without a clearly defined master data, the enterprise runs the risk of having multiple copies of data that are inconsistent with one another.
    MDM is typically more important in larger organizations. In fact, the bigger the organization, the more important the discipline of MDM is, because a bigger organization means that there are more disparate systems within the company, and the difficulty on providing a single source of truth, as well as the benefit of having master data, grows with each additional data source. A particularly big challenge to maintaining master data occurs when there is a merger/acquisition. Each of the organizations will have its own master data, and how to merge the two sets of data will be challenging. Let's take a look at the customer files: The two companies will likely have different unique identifiers for each customer. Addresses and phone numbers may not match. One may have a person's maiden name and the other the current last name. One may have a nickname (such as "Bill") and the other may have the full name (such as "William"). All these contribute to the difficulty in creating and maintain in a single set of master data.
    At the heart of the master data management program is the definition of the master data. Therefore, it is essential that we identify who is responsible for defining and enforcing the definition. Due to the importance of master data, a dedicated person or team should be appointed. At the minimum, a data steward should be identified. The responsible party can also be a group -- such as a data governance committee or a data governance council.

    Master Data Management vs Data Warehousing

    Based on the discussions so far, it seems like Master Data Management and Data Warehousing have a lot in common. For example, the effort of data transformation and cleansing is very similar to an ETL process in data warehousing, and in fact they can use the same ETL tools. In the real world, it is not uncommon to see MDM and data warehousing fall into the same project. On the other hand, it is important to call out the main differences between the two:
    1) Different Goals
    The main purpose of a data warehouse is to analyze data in a multidimensional fashion, while the main purpose of MDM is to create and maintain a single source of truth for a particular dimension within the organization. In addition, MDM requires solving the root cause of the inconsistent metadata, because master data needs to be propagated back to the source system in some way. In data warehousing, solving the root cause is not always needed, as it may be enough just to have a consistent view at the data warehousing level rather than having to ensure consistency at the data source level.
    2) Different Types of Data
    Master Data Management is only applied to entities and not transactional data, while a data warehouse includes data that are both transactional and non-transactional in nature. The easiest way to think about this is that MDM only affects data that exists in dimensional tables and not in fact tables, while in a data warehousing environment includes both dimensional tables and fact tables.
    3) Different Reporting Needs
    In data warehousing, it is important to deliver to end users the proper types of reports using the proper type of reporting tool to facilitate analysis. In MDM, the reporting needs are very different -- it is far more important to be able to provide reports on data governance, data quality, and compliance, rather than reports based on analytical needs.
    4) Where Data Is Used
    In a data warehouse, usually the only usage of this "single source of truth" is for applications that access the data warehouse directly, or applications that access systems that source their data straight from the data warehouse. Most of the time, the original data sources are not affected. In master data management, on the other hand, we often need to have a strategy to get a copy of the master data back to the source system. This poses challenges that do not exist in a data warehousing environment. For example, how do we sync the data back with the original source? Once a day? Once an hour? How do we handle cases where the data was modified as it went through the cleansing process? And how much modification do we need make do to the source system so it can use the master data? These questions represent some of the challenges MDM faces. Unfortunately, there is no easy answer to those questions, as the solution depends on a variety of factors specific to the organization, such as how many source systems there are, how easy / costly it is to modify the source system, and even how internal politics play out.

    Monday 25 June 2012

    Data Warehousing - ETL Tool Selection


    Buy vs. Build
    When it comes to ETL tool selection, it is not always necessary to purchase a third-party tool. This determination largely depends on three things:
    • Complexity of the data transformation: The more complex the data transformation is, the more suitable it is to purchase an ETL tool.
    • Data cleansing needs: Does the data need to go through a thorough cleansing exercise before it is suitable to be stored in the data warehouse? If so, it is best to purchase a tool with strong data cleansing functionalities. Otherwise, it may be sufficient to simply build the ETL routine from scratch.
    • Data volume. Available commercial tools typically have features that can speed up data movement. Therefore, buying a commercial product is a better approach if the volume of data transferred is large.
    ETL Tool Functionalities While the selection of a database and a hardware platform is a must, the selection of an ETL tool is highly recommended, but it's not a must. When you evaluate ETL tools, it pays to look for the following characteristics:
  • Functional capability: This includes both the 'transformation' piece and the 'cleansing' piece. In general, the typical ETL tools are either geared towards having strong transformation capabilities or having strong cleansing capabilities, but they are seldom very strong in both. As a result, if you know your data is going to be dirty coming in, make sure your ETL tool has strong cleansing capabilities. If you know there are going to be a lot of different data transformations, it then makes sense to pick a tool that is strong in transformation.
  • Ability to read directly from your data source: For each organization, there is a different set of data sources. Make sure the ETL tool you select can connect directly to your source data.
  • Metadata support: The ETL tool plays a key role in your metadata because it maps the source data to the destination, which is an important piece of the metadata. In fact, some organizations have come to rely on the documentation of their ETL tool as their metadata source. As a result, it is very important to select an ETL tool that works with your overall metadata strategy. Popular Tools
    • IBM WebSphere Information Integration (Ascential DataStage)
    • Ab Initio
    • Informatica
    • Talend
  • Business Intellegence Tools


    The most common tools used for business intelligence are as follows. They are listed in the following order: Increasing cost, increasing functionality, increasing business intelligence complexity, and decreasing number of total users.
    Excel
    Take a guess what's the most common business intelligence tool? You might be surprised to find out it's Microsoft Excel. There are several reasons for this:
    1. It's relatively cheap.
    2. It's commonly used. You can easily send an Excel sheet to another person without worrying whether the recipient knows how to read the numbers.
    3. It has most of the functionalities users need to display data.
    In fact, it is still so popular that all third-party reporting / OLAP tools have an "export to Excel" functionality. Even for home-built solutions, the ability to export numbers to Excel usually needs to be built.
    Excel is best used for business operations reporting and goals tracking.
    Reporting tool
    In this discussion, I am including both custom-built reporting tools and the commercial reporting tools together. They provide some flexibility in terms of the ability for each user to create, schedule, and run their own reports. The Reporting Tool Selection selection discusses how one should select an OLAP tool.
    Business operations reporting and dashboard are the most common applications for a reporting tool.
    OLAP tool
    OLAP tools are usually used by advanced users. They make it easy for users to look at the data from multiple dimensions. The OLAP Tool Selection selection discusses how one should select an OLAP tool.
    OLAP tools are used for multidimensional analysis.
    Data mining tool
    Data mining tools are usually only by very specialized users, and in an organization, even large ones, there are usually only a handful of users using data mining tools.
    Data mining tools are used for finding correlation among different factors.

    Business Intelligence


    Business intelligence is a term commonly associated with data warehousing. In fact, many of the tool vendors position their products as business intelligence software rather than data warehousing software. There are other occasions where the two terms are used interchangeably. So, exactly what is business inteligence?
    Business intelligence usually refers to the information that is available for the enterprise to make decisions on. A data warehousing (or data mart) system is the backend, or the infrastructural, component for achieving business intellignce. Business intelligence also includes the insight gained from doing data mining analysis, as well as unstrctured data (thus the need fo content management systems). For our purposes here, we will discuss business intelligence in the context of using a data warehouse infrastructure.
    This section includes the following:
    Business intelligence tools: Tools commonly used for business intelligence.
    Business intelligence uses: Different forms of business intelligence.
    Business intelligence news: News in the business intelligence area.

    Conformed Dimension


    A conformed dimension is a dimension that has exactly the same meaning and content when being referred from different fact tables. A conformed dimension can refer to multiple tables in multiple data marts within the same organization. For two dimension tables to be considered as conformed, they must either be identical or one must be a subset of another. There cannot be any other type of difference between the two tables. For example, two dimension tables that are exactly the same except for the primary key are not considered conformed dimensions.
    Why is conformed dimension important? This goes back to the definition of data warehouse being "integrated." Integrated means that even if a particular entity had different meanings and different attributes in the source systems, there must be a single version of this entity once the data flows into the data warehouse.
    The time dimension is a common conformed dimension in an organization. Usually the only rules to consider with the time dimension is whether there is a fiscal year in addition to the calendar year and the definition of a week. Fortunately, both are relatively easy to resolve. In the case of fiscal vs calendar year, one may go with either fiscal or calendar, or an alternative is to have two separate conformed dimensions, one for fiscal year and one for calendar year. The definition of a week is also something that can be different in large organizations: Finance may use Saturday to Friday, while marketing may use Sunday to Saturday. In this case, we should decide on a definition and move on. The nice thing about the time dimension is once these rules are set, the values in the dimension table will never change. For example, October 16th will never become the 15th day in October.
    Not all conformed dimensions are as easy to produce as the time dimension. An example is the customer dimension. In any organization with some history, there is a high likelihood that different customer databases exist in different parts of the organization. To achieve a conformed customer dimension means those data must be compared against each other, rules must be set, and data must be cleansed. In addition, when we are doing incremental data loads into the data warehouse, we'll need to apply the same rules to the new values to make sure we are only adding truly new customers to the customer dimension.
    Building a conformed dimension also part of the process in master data management, or MDM. In MDM, one must not only make sure the master data dimensions are conformed, but that conformity needs to be brought back to the source systems.

    Junk Dimension


    In data warehouse design, frequently we run into a situation where there are yes/no indicator fields in the source system. Through business analysis, we know it is necessary to keep those information in the fact table. However, if keep all those indicator fields in the fact table, not only do we need to build many small dimension tables, but the amount of information stored in the fact table also increases tremendously, leading to possible performance and management issues.
    Junk dimension is the way to solve this problem. In a junk dimension, we combine these indicator fields into a single dimension. This way, we'll only need to build a single dimension table, and the number of fields in the fact table, as well as the size of the fact table, can be decreased. The content in the junk dimension table is the combination of all possible values of the individual indicator fields.
    Let's look at an example. Assuming that we have the following fact table:
    Fact Table Before Junk Dimension
    In this example, the last 3 fields are all indicator fields. In this existing format, each one of them is a dimension. Using the junk dimension principle, we can combine them into a single junk dimension, resulting in the following fact table:
    Fact Table With Junk Dimension
    Note that now the number of dimensions in the fact table went from 7 to 5.
    The content of the junk dimension table would look like the following:
    Junk Dimension Example
    In this case, we have 3 possible values for the TXN_CODE field, 2 possible values for the COUPON_IND field, and 2 possible values for the PREPAY_IND field. This results in a total of 3 x 2 x 2 = 12 rows for the junk dimension table.
    By using a junk dimension to replace the 3 indicator fields, we have decreased the number of dimensions by 2 and also decreased the number of fields in the fact table by 2. This will result in a data warehousing environment that offer better performance as well as being easier to manage.

    Sunday 24 June 2012

    Factless Fact Table


    A factless fact table is a fact table that does not have any measures. It is essentially an intersection of dimensions. On the surface, a factless fact table does not make sense, since a fact table is, after all, about facts. However, there are situations where having this kind of relationship makes sense in data warehousing.
    For example, think about a record of student attendance in classes. In this case, the fact table would consist of 3 dimensions: the student dimension, the time dimension, and the class dimension. This factless fact table would look like the following:
    Factless Fact Table Example
    The only measure that you can possibly attach to each combination is "1" to show the presence of that particular combination. However, adding a fact that always shows 1 is redundant because we can simply use the COUNT function in SQL to answer the same questions.
    Factless fact tables offer the most flexibility in data warehouse design. For example, one can easily answer the following questions with this factless fact table:
    • How many students attended a particular class on a particular day?
    • How many classes on average does a student attend on a given day?
    Without using a factless fact table, we will need two separate fact tables to answer the above two questions. With the above factless fact table, it becomes the only fact table that's needed.

    Bill Inmon vs. Ralph Kimball


    In the data warehousing field, we often hear about discussions on where a person / organization's philosophy falls into Bill Inmon's camp or into Ralph Kimball's camp. We describe below the difference between the two.
    Bill Inmon's paradigm: Data warehouse is one part of the overall business intelligence system. An enterprise has one data warehouse, and data marts source their information from the data warehouse. In the data warehouse, information is stored in 3rd normal form.
    Ralph Kimball's paradigm: Data warehouse is the conglomerate of all data marts within the enterprise. Information is always stored in the dimensional model.
    There is no right or wrong between these two ideas, as they represent different data warehousing philosophies. In reality, the data warehouse in most enterprises are closer to Ralph Kimball's idea. This is because most data warehouses started out as a departmental effort, and hence they originated as a data mart. Only when more data marts are built later do they evolve into a data warehouse.

    Saturday 23 June 2012

    MOLAP, ROLAP, And HOLAP


    In the OLAP world, there are mainly two different types: Multidimensional OLAP (MOLAP) and Relational OLAP (ROLAP). Hybrid OLAP (HOLAP) refers to technologies that combine MOLAP and ROLAP.
    MOLAP
    This is the more traditional way of OLAP analysis. In MOLAP, data is stored in a multidimensional cube. The storage is not in the relational database, but in proprietary formats.
    Advantages:
    • Excellent performance: MOLAP cubes are built for fast data retrieval, and is optimal for slicing and dicing operations.
    • Can perform complex calculations: All calculations have been pre-generated when the cube is created. Hence, complex calculations are not only doable, but they return quickly.
    Disadvantages:
    • Limited in the amount of data it can handle: Because all calculations are performed when the cube is built, it is not possible to include a large amount of data in the cube itself. This is not to say that the data in the cube cannot be derived from a large amount of data. Indeed, this is possible. But in this case, only summary-level information will be included in the cube itself.
    • Requires additional investment: Cube technology are often proprietary and do not already exist in the organization. Therefore, to adopt MOLAP technology, chances are additional investments in human and capital resources are needed.
    ROLAP
    This methodology relies on manipulating the data stored in the relational database to give the appearance of traditional OLAP's slicing and dicing functionality. In essence, each action of slicing and dicing is equivalent to adding a "WHERE" clause in the SQL statement.
    Advantages:
    • Can handle large amounts of data: The data size limitation of ROLAP technology is the limitation on data size of the underlying relational database. In other words, ROLAP itself places no limitation on data amount.
    • Can leverage functionalities inherent in the relational database: Often, relational database already comes with a host of functionalities. ROLAP technologies, since they sit on top of the relational database, can therefore leverage these functionalities.
    Disadvantages:
    • Performance can be slow: Because each ROLAP report is essentially a SQL query (or multiple SQL queries) in the relational database, the query time can be long if the underlying data size is large.
    • Limited by SQL functionalities: Because ROLAP technology mainly relies on generating SQL statements to query the relational database, and SQL statements do not fit all needs (for example, it is difficult to perform complex calculations using SQL), ROLAP technologies are therefore traditionally limited by what SQL can do. ROLAP vendors have mitigated this risk by building into the tool out-of-the-box complex functions as well as the ability to allow users to define their own functions.
    HOLAP
    HOLAP technologies attempt to combine the advantages of MOLAP and ROLAP. For summary-type information, HOLAP leverages cube technology for faster performance. When detail information is needed, HOLAP can "drill through" from the cube into the underlying relational data.

    What Is OLAP

    OLAP stands for On-Line Analytical Processing. The first attempt to provide a definition to OLAP was by Dr. Codd, who proposed 12 rules for OLAP. Later, it was discovered that this particular white paper was sponsored by one of the OLAP tool vendors, thus causing it to lose objectivity. The OLAP Report has proposed the FASMI test, Fast Analysis of Shared Multidimensional Information. For a more detailed description of both Dr. Codd's rules and the FASMI test, please visit The OLAP Report.

    For people on the business side, the key feature out of the above list is "Multidimensional." In other words, the ability to analyze metrics in different dimensions such as time, geography, gender, product, etc. For example, sales for the company is up. What region is most responsible for this increase? Which store in this region is most responsible for the increase? What particular product category or categories contributed the most to the increase? Answering these types of questions in order means that you are performing an OLAP analysis.

    Depending on the underlying technology used, OLAP can be braodly divided into two different camps: MOLAP and ROLAP. A discussion of the different OLAP types can be found in the MOLAP, ROLAP, and HOLAP section

    Data Integrity


    Data integrity refers to the validity of data, meaning data is consistent and correct. In the data warehousing field, we frequently hear the term, "Garbage In, Garbage Out." If there is no data integrity in the data warehouse, any resulting report and analysis will not be useful.
    In a data warehouse or a data mart, there are three areas of where data integrity needs to be enforced:
    Database level
    We can enforce data integrity at the database level. Common ways of enforcing data integrity include:
    Referential integrity
    The relationship between the primary key of one table and the foreign key of another table must always be maintained. For example, a primary key cannot be deleted if there is still a foreign key that refers to this primary key.
    Primary key / Unique constraint
    Primary keys and the UNIQUE constraint are used to make sure every row in a table can be uniquely identified.
    Not NULL vs NULL-able
    For columns identified as NOT NULL, they may not have a NULL value.
    Valid Values
    Only allowed values are permitted in the database. For example, if a column can only have positive integers, a value of '-1' cannot be allowed.
    ETL process
    For each step of the ETL process, data integrity checks should be put in place to ensure that source data is the same as the data in the destination. Most common checks include record counts or record sums.
    Access level
    We need to ensure that data is not altered by any unauthorized means either during the ETL process or in the data warehouse. To do this, there needs to be safeguards against unauthorized access to data (including physical access to the servers), as well as logging of all data access history. Data integrity can only ensured if there is no unauthorized access to the data.

    Conceptual, Logical, And Physical Data Models


    The three level of data modeling, conceptual data model, logical data model, and physical data model, were discussed in prior sections. Here we compare these three types of data models. The table below compares the different features:
    FeatureConceptualLogicalPhysical
    Entity Names
     
    Entity Relationships
     
    Attributes  
     
    Primary Keys  
    Foreign Keys  
    Table Names    
    Column Names    
    Column Data Types    
    Below we show the conceptual, logical, and physical versions of a single data model.
    Conceptual Model Design

    Conceptual Model Design
    Logical Model Design

    Logical Model Design
    Physical Model Design

    Physical Model Design
    We can see that the complexity increases from conceptual to logical to physical. This is why we always first start with the conceptual data model (so we understand at high level what are the different entities in our data and how they relate to one another), then move on to the logical data model (so we understand the details of our data without worrying about how they will actually implemented), and finally the physical data model (so we know exactly how to implement our data model in the database of choice). In a data warehousing project, sometimes the conceptual data model and the logical data model are considered as a single deliverable.

    Slowly Changing Dimensions


    The "Slowly Changing Dimension" problem is a common one particular to data warehousing. In a nutshell, this applies to cases where the attribute for a record varies over time. We give an example below:
    Christina is a customer with ABC Inc. She first lived in Chicago, Illinois. So, the original entry in the customer lookup table has the following record:

    Customer Key Name State
    1001 Christina Illinois
    At a later date, she moved to Los Angeles, California on January, 2003. How should ABC Inc. now modify its customer table to reflect this change? This is the "Slowly Changing Dimension" problem.
    There are in general three ways to solve this type of problem, and they are categorized as follows:
    Type 1: The new record replaces the original record. No trace of the old record exists.
    Type 2: A new record is added into the customer dimension table. Therefore, the customer is treated essentially as two people.
    Type 3: The original record is modified to reflect the change.
    We next take a look at each of the scenarios and how the data model and the data looks like for each of them. Finally, we compare and contrast among the three alternatives.

    Friday 22 June 2012

    Type 3 Slowly Changing Dimension


    In Type 3 Slowly Changing Dimension, there will be two columns to indicate the particular attribute of interest, one indicating the original value, and one indicating the current value. There will also be a column that indicates when the current value becomes active.
    In our example, recall we originally have the following table:

    Customer Key Name State
    1001 Christina Illinois
    To accommodate Type 3 Slowly Changing Dimension, we will now have the following columns:
    • Customer Key
    • Name
    • Original State
    • Current State
    • Effective Date
    After Christina moved from Illinois to California, the original information gets updated, and we have the following table (assuming the effective date of change is January 15, 2003):

    Customer Key Name Original State Current State Effective Date
    1001 Christina Illinois California 15-JAN-2003
    Advantages:
    - This does not increase the size of the table, since new information is updated.
    - This allows us to keep some part of history.
    Disadvantages:
    - Type 3 will not be able to keep all history where an attribute is changed more than once. For example, if Christina later moves to Texas on December 15, 2003, the California information will be lost.
    Usage:
    Type 3 is rarely used in actual practice.
    When to use Type 3:
    Type III slowly changing dimension should only be used when it is necessary for the data warehouse to track historical changes, and when such changes will only occur for a finite number of time.

    Type 2 Slowly Changing Dimension


    In Type 2 Slowly Changing Dimension, a new record is added to the table to represent the new information. Therefore, both the original and the new record will be present. The newe record gets its own primary key.
    In our example, recall we originally have the following table:

    Customer Key Name State
    1001 Christina Illinois
    After Christina moved from Illinois to California, we add the new information as a new row into the table:

    Customer Key Name State
    1001 Christina Illinois
    1005 Christina California
    Advantages:
    - This allows us to accurately keep all historical information.
    Disadvantages:
    - This will cause the size of the table to grow fast. In cases where the number of rows for the table is very high to start with, storage and performance can become a concern.
    - This necessarily complicates the ETL process.
    Usage:
    About 50% of the time.
    When to use Type 2:
    Type 2 slowly changing dimension should be used when it is necessary for the data warehouse to track historical changes.