Saturday 23 June 2012

MOLAP, ROLAP, And HOLAP


In the OLAP world, there are mainly two different types: Multidimensional OLAP (MOLAP) and Relational OLAP (ROLAP). Hybrid OLAP (HOLAP) refers to technologies that combine MOLAP and ROLAP.
MOLAP
This is the more traditional way of OLAP analysis. In MOLAP, data is stored in a multidimensional cube. The storage is not in the relational database, but in proprietary formats.
Advantages:
  • Excellent performance: MOLAP cubes are built for fast data retrieval, and is optimal for slicing and dicing operations.
  • Can perform complex calculations: All calculations have been pre-generated when the cube is created. Hence, complex calculations are not only doable, but they return quickly.
Disadvantages:
  • Limited in the amount of data it can handle: Because all calculations are performed when the cube is built, it is not possible to include a large amount of data in the cube itself. This is not to say that the data in the cube cannot be derived from a large amount of data. Indeed, this is possible. But in this case, only summary-level information will be included in the cube itself.
  • Requires additional investment: Cube technology are often proprietary and do not already exist in the organization. Therefore, to adopt MOLAP technology, chances are additional investments in human and capital resources are needed.
ROLAP
This methodology relies on manipulating the data stored in the relational database to give the appearance of traditional OLAP's slicing and dicing functionality. In essence, each action of slicing and dicing is equivalent to adding a "WHERE" clause in the SQL statement.
Advantages:
  • Can handle large amounts of data: The data size limitation of ROLAP technology is the limitation on data size of the underlying relational database. In other words, ROLAP itself places no limitation on data amount.
  • Can leverage functionalities inherent in the relational database: Often, relational database already comes with a host of functionalities. ROLAP technologies, since they sit on top of the relational database, can therefore leverage these functionalities.
Disadvantages:
  • Performance can be slow: Because each ROLAP report is essentially a SQL query (or multiple SQL queries) in the relational database, the query time can be long if the underlying data size is large.
  • Limited by SQL functionalities: Because ROLAP technology mainly relies on generating SQL statements to query the relational database, and SQL statements do not fit all needs (for example, it is difficult to perform complex calculations using SQL), ROLAP technologies are therefore traditionally limited by what SQL can do. ROLAP vendors have mitigated this risk by building into the tool out-of-the-box complex functions as well as the ability to allow users to define their own functions.
HOLAP
HOLAP technologies attempt to combine the advantages of MOLAP and ROLAP. For summary-type information, HOLAP leverages cube technology for faster performance. When detail information is needed, HOLAP can "drill through" from the cube into the underlying relational data.
What Is OLAP

OLAP stands for On-Line Analytical Processing. The first attempt to provide a definition to OLAP was by Dr. Codd, who proposed 12 rules for OLAP. Later, it was discovered that this particular white paper was sponsored by one of the OLAP tool vendors, thus causing it to lose objectivity. The OLAP Report has proposed the FASMI test, Fast Analysis of Shared Multidimensional Information. For a more detailed description of both Dr. Codd's rules and the FASMI test, please visit The OLAP Report.

For people on the business side, the key feature out of the above list is "Multidimensional." In other words, the ability to analyze metrics in different dimensions such as time, geography, gender, product, etc. For example, sales for the company is up. What region is most responsible for this increase? Which store in this region is most responsible for the increase? What particular product category or categories contributed the most to the increase? Answering these types of questions in order means that you are performing an OLAP analysis.

Depending on the underlying technology used, OLAP can be braodly divided into two different camps: MOLAP and ROLAP. A discussion of the different OLAP types can be found in the MOLAP, ROLAP, and HOLAP section

Data Integrity


Data integrity refers to the validity of data, meaning data is consistent and correct. In the data warehousing field, we frequently hear the term, "Garbage In, Garbage Out." If there is no data integrity in the data warehouse, any resulting report and analysis will not be useful.
In a data warehouse or a data mart, there are three areas of where data integrity needs to be enforced:
Database level
We can enforce data integrity at the database level. Common ways of enforcing data integrity include:
Referential integrity
The relationship between the primary key of one table and the foreign key of another table must always be maintained. For example, a primary key cannot be deleted if there is still a foreign key that refers to this primary key.
Primary key / Unique constraint
Primary keys and the UNIQUE constraint are used to make sure every row in a table can be uniquely identified.
Not NULL vs NULL-able
For columns identified as NOT NULL, they may not have a NULL value.
Valid Values
Only allowed values are permitted in the database. For example, if a column can only have positive integers, a value of '-1' cannot be allowed.
ETL process
For each step of the ETL process, data integrity checks should be put in place to ensure that source data is the same as the data in the destination. Most common checks include record counts or record sums.
Access level
We need to ensure that data is not altered by any unauthorized means either during the ETL process or in the data warehouse. To do this, there needs to be safeguards against unauthorized access to data (including physical access to the servers), as well as logging of all data access history. Data integrity can only ensured if there is no unauthorized access to the data.

Conceptual, Logical, And Physical Data Models


The three level of data modeling, conceptual data model, logical data model, and physical data model, were discussed in prior sections. Here we compare these three types of data models. The table below compares the different features:
FeatureConceptualLogicalPhysical
Entity Names
 
Entity Relationships
 
Attributes  
 
Primary Keys  
Foreign Keys  
Table Names    
Column Names    
Column Data Types    
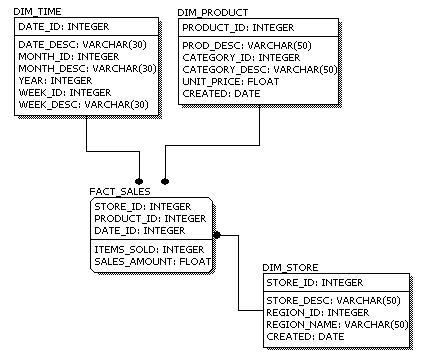
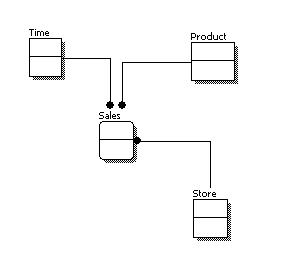
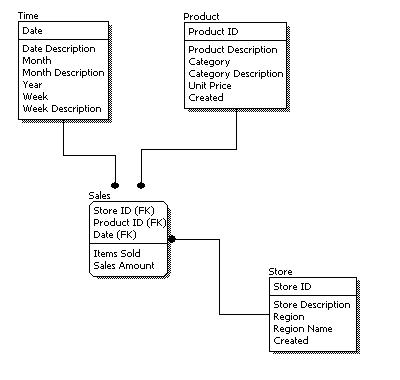
Below we show the conceptual, logical, and physical versions of a single data model.
Conceptual Model Design

Conceptual Model Design
Logical Model Design

Logical Model Design
Physical Model Design

Physical Model Design
We can see that the complexity increases from conceptual to logical to physical. This is why we always first start with the conceptual data model (so we understand at high level what are the different entities in our data and how they relate to one another), then move on to the logical data model (so we understand the details of our data without worrying about how they will actually implemented), and finally the physical data model (so we know exactly how to implement our data model in the database of choice). In a data warehousing project, sometimes the conceptual data model and the logical data model are considered as a single deliverable.

Slowly Changing Dimensions


The "Slowly Changing Dimension" problem is a common one particular to data warehousing. In a nutshell, this applies to cases where the attribute for a record varies over time. We give an example below:
Christina is a customer with ABC Inc. She first lived in Chicago, Illinois. So, the original entry in the customer lookup table has the following record:

Customer Key Name State
1001 Christina Illinois
At a later date, she moved to Los Angeles, California on January, 2003. How should ABC Inc. now modify its customer table to reflect this change? This is the "Slowly Changing Dimension" problem.
There are in general three ways to solve this type of problem, and they are categorized as follows:
Type 1: The new record replaces the original record. No trace of the old record exists.
Type 2: A new record is added into the customer dimension table. Therefore, the customer is treated essentially as two people.
Type 3: The original record is modified to reflect the change.
We next take a look at each of the scenarios and how the data model and the data looks like for each of them. Finally, we compare and contrast among the three alternatives.